Product-Market Fit for Engineers: Measure It, Don't Declare It


Engineers are trained to think in systems. Inputs, outputs, feedback loops. So it's surprising how many technical founders treat product-market fit as if it were a deployment flag — either it's true or it's false, and once you flip it, you move on.
That mental model is wrong. And it's expensive.
PMF is a continuous, measurable signal. It shifts with cohort composition, competitive pressure, and how deeply users have embedded your product into their workflow. PMF is a spectrum, not a switch. You can have it in one segment and not another. You can have it today and lose it by Q4 if a better alternative ships. Treating it as a binary gate means you stop collecting signal at exactly the moment you most need it.
Here's how to build PMF measurement into your engineering process the same way you'd build any other instrumented system.
The Retention Curve Is Your First Instrument
Before you run any survey or talk to a single user, open your analytics tool and plot a cohort retention chart. This is the most honest signal you have.
A healthy retention curve drops steeply in the first few days or weeks as casual tire-kickers churn out, then flattens into a stable plateau. That plateau represents your core customer base: the people for whom your product solves a real, recurring problem.
The shape of that curve tells you everything. A flattening curve means some users found lasting value. A curve to zero means the product is a novelty. No amount of marketing spend, product polish, or feature shipping changes what that shape is telling you.
For B2B SaaS specifically, a curve that continues declining toward zero indicates the product isn't creating lasting habits. Commonly cited benchmarks suggest a curve that stabilizes above roughly 20–30% may indicate a retained core segment — though this varies substantially by product type, price point, and go-to-market motion, and no single threshold should be treated as authoritative across all contexts. Consumer products have different benchmarks, but the rule holds: if your retention curve drops to zero, you don't have PMF. To achieve PMF, you want your retention curve to flatten out to a non-zero retention rate percentage.
For most B2B SaaS products, if you haven't seen meaningful retention stabilization by month three to six, treat that as a scaling red flag — though enterprise products with longer onboarding and sales cycles may require more time before drawing conclusions. Don't scale into a leaky bucket. If the curve doesn't flatten, do not scale. Scaling before retention has stabilised just accelerates the leaky bucket.
Watch Your Organic Referral Rate Climb
Retention tells you whether users are staying. Organic referral rate tells you whether they believe in the product enough to put their reputation behind it.
This is a PMF signal most engineers underinstrument. It doesn't show up in your API logs. You have to track acquisition source at signup, then calculate what percentage of new accounts came from word-of-mouth, direct traffic, or community recommendations — with zero paid push.
Paid growth stops when the budget stops. Organic compounds. Word of mouth is the cleanest PMF signal.
As a rough directional heuristic — without a widely agreed standard — if the majority of new accounts are arriving via organic channels rather than paid acquisition, that suggests the product is generating genuine pull. Conversely, if fewer than 20–30% of new accounts arrive organically, you may be dependent on paid spend to mask weak pull. These are practitioner rules of thumb, not statistically validated thresholds.
Rising organic referral rate is also a leading indicator that your retention curve will flatten further. The two metrics tend to compound together: users who stay refer others, those referrals convert better because they came with social proof, and the cohort quality improves over time. Track both together.
Read Your Support Tickets as a PMF Signal
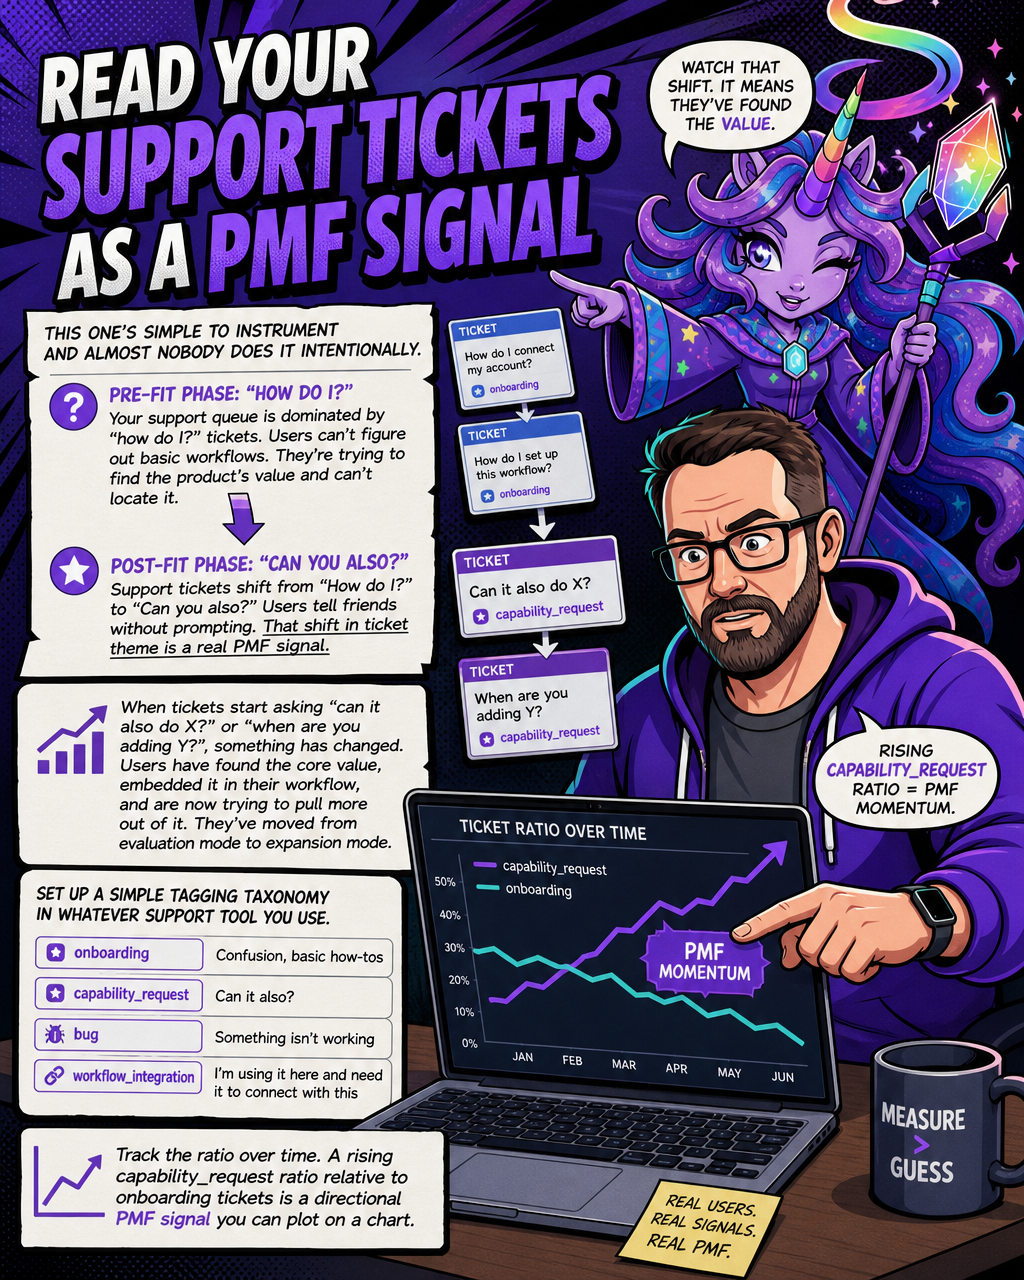
This one's simple to instrument and almost nobody does it intentionally.
In the pre-fit phase, your support queue is dominated by "how do I?" tickets. Users can't figure out basic workflows. They're trying to find the product's value and can't locate it. Support tickets shift from "How do I?" to "Can you also?" Users tell friends without prompting. That shift in ticket theme is a real PMF signal.
When tickets start asking "can it also do X?" or "when are you adding Y?", something has changed. Users have found the core value, embedded it in their workflow, and are now trying to pull more out of it. They've moved from evaluation mode to expansion mode.
Set up a simple tagging taxonomy in whatever support tool you use. Tag tickets as onboarding (confusion, basic how-tos), capability_request (can it also?), bug, and workflow_integration (I'm using it here and need it to connect with this). Track the ratio over time. A rising capability_request ratio relative to onboarding tickets is a directional PMF signal you can plot on a chart.
Technical Elegance Is Not Market Fit
This is the trap that catches experienced engineers more often than junior ones.
You've built something architecturally sound. Clean abstractions. Fast response times. Well-documented API. Test coverage that would make a senior engineer nod. And then… nobody uses it with any consistency.
The problem is that technical quality solves for developer satisfaction, not user necessity. A product can be a pleasure to build and a zero on the Sean Ellis survey at the same time.
The Sean Ellis question measures dependency, not satisfaction. That distinction matters. Satisfied users may still leave if a better option appears. Dependent users are much less likely to leave, because switching requires dismantling workflows built around your product — creating meaningful friction that satisfied-but-not-dependent users don't face.
Engineers often optimise for the wrong feedback loop. They ship a feature, check whether it works (tests pass, no errors in prod), and move to the next one. But working correctly and being needed are completely different things. A solution that is architecturally sound but solves a problem users don't encounter daily is still pre-fit. It doesn't matter how elegant the implementation is.
The test isn't "did I build this well?" It's "do people's workflows break without this?" Those are different questions. Only one of them measures PMF.
The Sean Ellis Threshold: A Benchmark You Can Actually Operationalise
Once you have at least 40 active users who've engaged with the core product in the last two weeks, you can begin collecting PMF survey responses — though treat results as directional until you reach 100 responses, at which point the signal becomes more reliable. One question. Straightforward to implement.
Its core question — "How would you feel if you could no longer use this product?" — establishes the 40% threshold: if 40%+ of users say "Very disappointed," the product has achieved product-market fit.
Sean Ellis arrived at 40% through empirical observation across a range of startups he worked with — though the methodology has not been formally published or peer-reviewed, and the threshold is best understood as a practitioner heuristic rather than a statistically validated benchmark. He observed a consistent pattern: above 40%, companies tended to grow more easily, had stronger word-of-mouth, and faced "good problems" like scaling infrastructure and hiring fast enough. Below 25%, they struggled at every level.
It's worth noting that 40% is a high bar — and intentionally so. At first glance, 40% might not sound like a lot, but in practice very few products exceed that. For context, surveys of Slack users during its rapid growth phase reportedly found well over 40% would be very disappointed without it — consistent with the strong PMF Slack demonstrated during that period, though the specific figures are not independently verified.
A few implementation notes for engineers who want to instrument this correctly:
Who to survey: Aim to collect at least 40 responses before drawing any conclusions — Ellis's original stated minimum — and treat results as directional below 100 responses, where the 40% threshold becomes more statistically reliable.
What "very disappointed" means: Only "Very disappointed" counts — "Somewhat disappointed" means they'd miss it but survive without it, which is preference, not dependency.
Track it over time: Treat the score as a moving target. PMF is a moving target. Pricing changes, competitor launches, and audience shifts all move the number. Run the survey every quarter, not just once.
According to Superhuman CEO Rahul Vohra's widely cited account — published via First Round Review and based on self-reported internal data — Superhuman used this framework to go from 22% to 58% by segmenting users, doubling down on what worked, and addressing what held others back. The figures are self-reported rather than independently audited, but the segmentation approach Vohra described has been influential in how practitioners apply the Ellis framework. The survey isn't just a pass/fail gate — it's a segmentation tool. The qualitative data behind the score tells you which users feel dependency, and why.
Iteration Velocity Is a PMF Lever
Here's the part most engineering-focused founders miss: your deployment pipeline is a PMF tool.
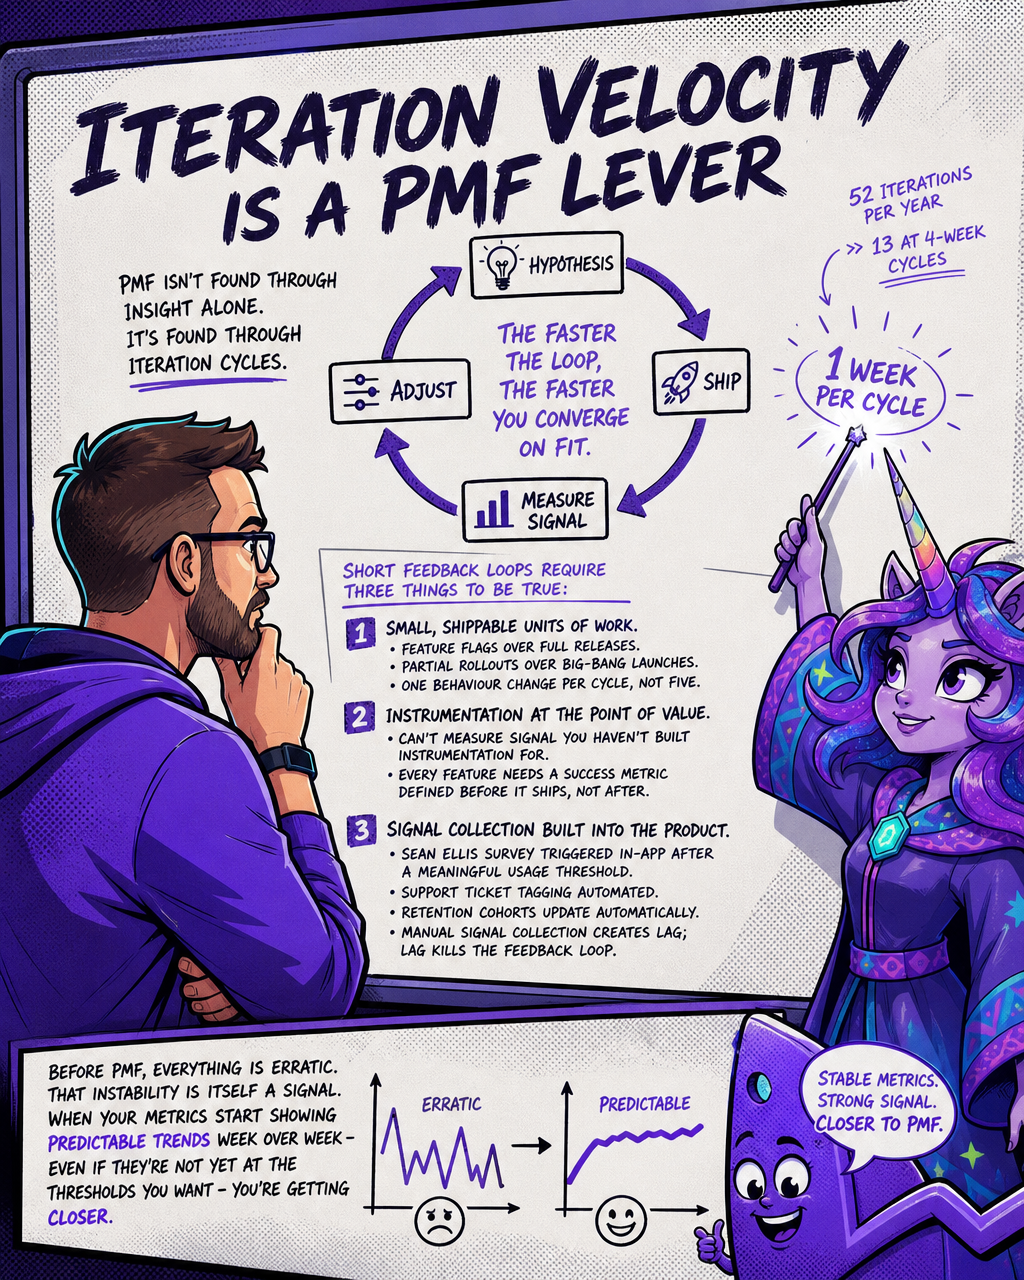
PMF isn't found through insight alone. It's found through iteration cycles — hypothesis, ship, measure signal, adjust. The faster you can complete that loop, the faster you converge on fit.
As markets evolve and new competitors or technology shifts emerge, your once-stable PMF can evaporate. Continuous validation is the only defense.
Think about it in engineering terms. If your deploy-to-signal cycle takes four weeks (two weeks to ship a feature, one week to collect enough data, one week to analyse), you get 13 iterations per year. If you compress that to one week per cycle, you get 52. That's four times as many shots at finding fit before your runway expires.
Short feedback loops require three things to be true simultaneously:
- Small, shippable units of work. Feature flags over full releases. Partial rollouts over big-bang launches. One behaviour change per cycle, not five.
- Instrumentation at the point of value. You can't measure signal you haven't built instrumentation for. Every feature needs a success metric defined before it ships, not after.
- Signal collection built into the product. The Sean Ellis survey should be triggered in-app after a meaningful usage threshold, not sent manually. Support ticket tagging should be automated. Retention cohorts should update automatically. Manual signal collection creates lag; lag kills the feedback loop.
One thing that is always consistent is the idea that your metrics become more stable and predictable as you achieve PMF. Before PMF, everything is erratic. That instability is itself a signal. When your metrics start showing predictable trends week over week — even if they're not yet at the thresholds you want — you're getting closer.
What to Instrument, Practically
If you're reading this and wondering what to build first, here's a prioritised list:
Week one: Set up cohort retention tracking in Mixpanel, Amplitude, or PostHog. Plot your first cohort chart. Note whether the curve flattens.
Week two: Add acquisition source tracking at signup. Start calculating organic vs. paid breakdown weekly.
This month: Build a simple support ticket tagging taxonomy. Start the ratio tracking. Deploy the Sean Ellis survey in-app, triggered at meaningful usage.
Ongoing: Run the Ellis survey quarterly with active users. Track all four metrics on a single dashboard: Ellis score, day-30 retention rate, organic acquisition %, and support ticket theme ratio. Review monthly.
PMF isn't something you declare. You don't find PMF once. You build it, then defend it as the market shifts. Engineers who treat it as a measurable system — not a subjective feeling — find it faster, and they know when they're losing it before it's too late to respond.
The product you're building right now is either accumulating fit signal or it isn't. The good news: you can start measuring that today.
Want a venture engine that closes the loop from opportunity discovery through build through pipeline, so the signal you collect feeds the next iteration automatically? Supramono is built for exactly that. Discover validated opportunities, ship production-ready products, and fill your sales pipeline — all in one platform. Try it free at supramono.com.
Supramono
The agentic GTM platform for small marketing agencies
The agentic GTM platform for small marketing agencies
Learn more about Supramono and get started today.
Visit Supramono