TAM, SAM, SOM: A Market Sizing Guide for Engineers


What the numbers actually mean, and why most founders get them wrong
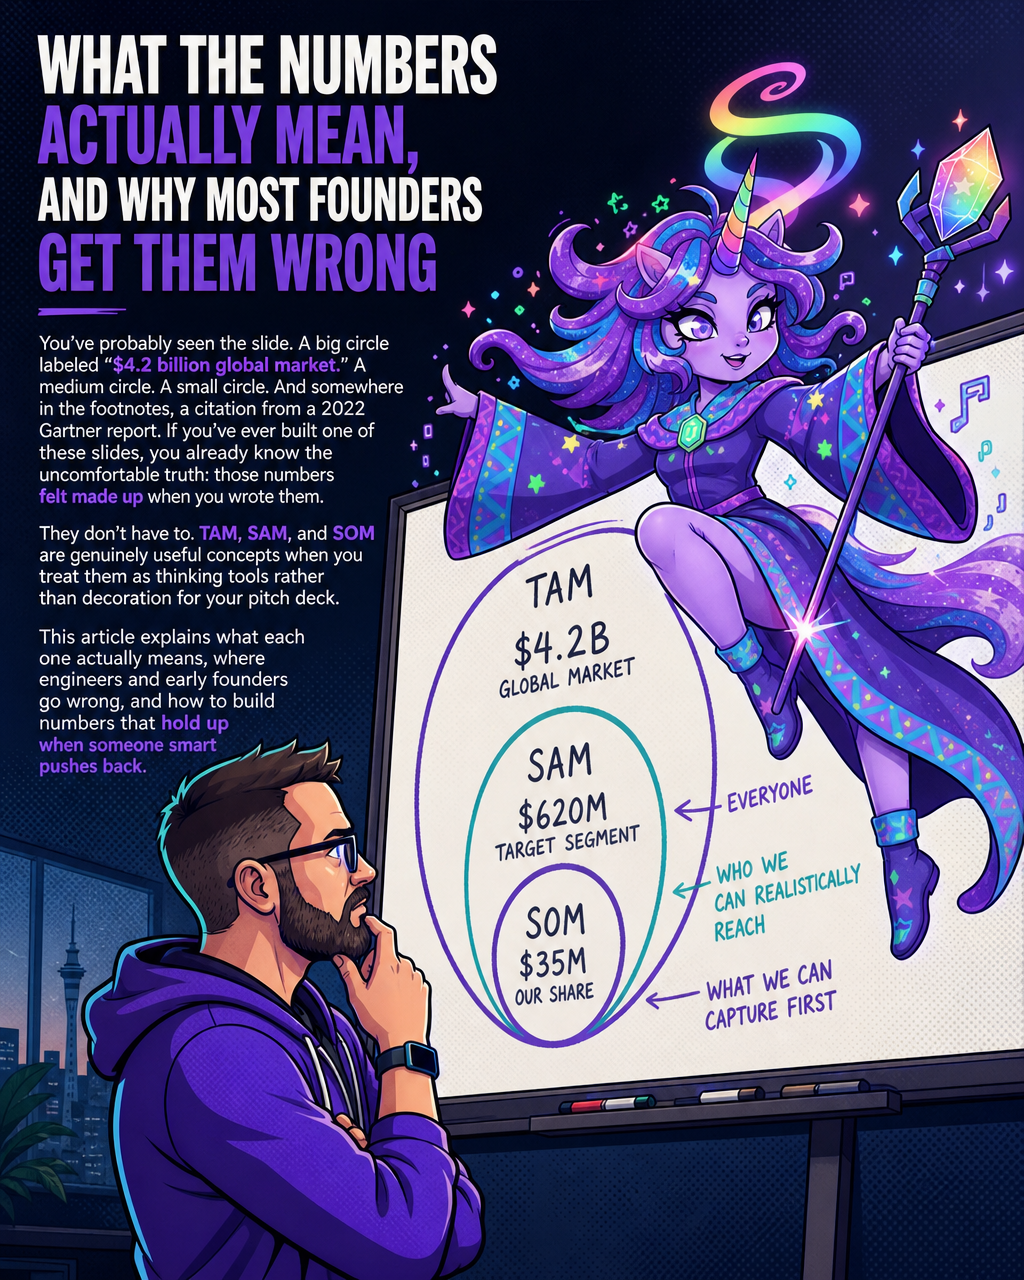
You've probably seen the slide. A big circle labeled "$4.2 billion global market." A medium circle. A small circle. And somewhere in the footnotes, a citation from a 2022 Gartner report. If you've ever built one of these slides, you already know the uncomfortable truth: those numbers felt made up when you wrote them.
They don't have to. TAM, SAM, and SOM are genuinely useful concepts when you treat them as thinking tools rather than decoration for your pitch deck. This article explains what each one actually means, where engineers and early founders go wrong, and how to build numbers that hold up when someone smart pushes back.
TAM is a ceiling, not a target
Total addressable market is the theoretical maximum revenue available if every possible customer bought your solution at full price, with zero competition, and no friction. It's the ceiling of the market, not the size of your opportunity.
That distinction matters more than it sounds. TAM answers one question: is there a market worth entering at all? Many venture investors look for TAMs in the billions, though thresholds vary significantly by fund size, stage, and sector — some seed-stage investors target much smaller markets, and some niche SaaS businesses achieve strong returns well below what's often cited as the threshold. TAM sets the upper bound so you know the game is worth playing.
What TAM does not tell you: where to start, who to go after, what to build first, or whether you can actually win. Engineers often over-index on TAM because large numbers feel validating. But a big ceiling number is table stakes, not a strategy.
The cleanest formula is straightforward. TAM = number of potential customers × average annual revenue per customer. For illustration, if there were several hundred million small businesses globally — a figure that varies widely depending on how "small business" is defined and which data sources you use — and your ACV were $500, your theoretical TAM ceiling would be in the hundreds of billions. That kind of ceiling confirms the category is large enough to support a serious company. It doesn't mean you're going after all of it, and real TAM calculations require sourced customer counts rather than assumed ones.
SAM: the market you can actually serve
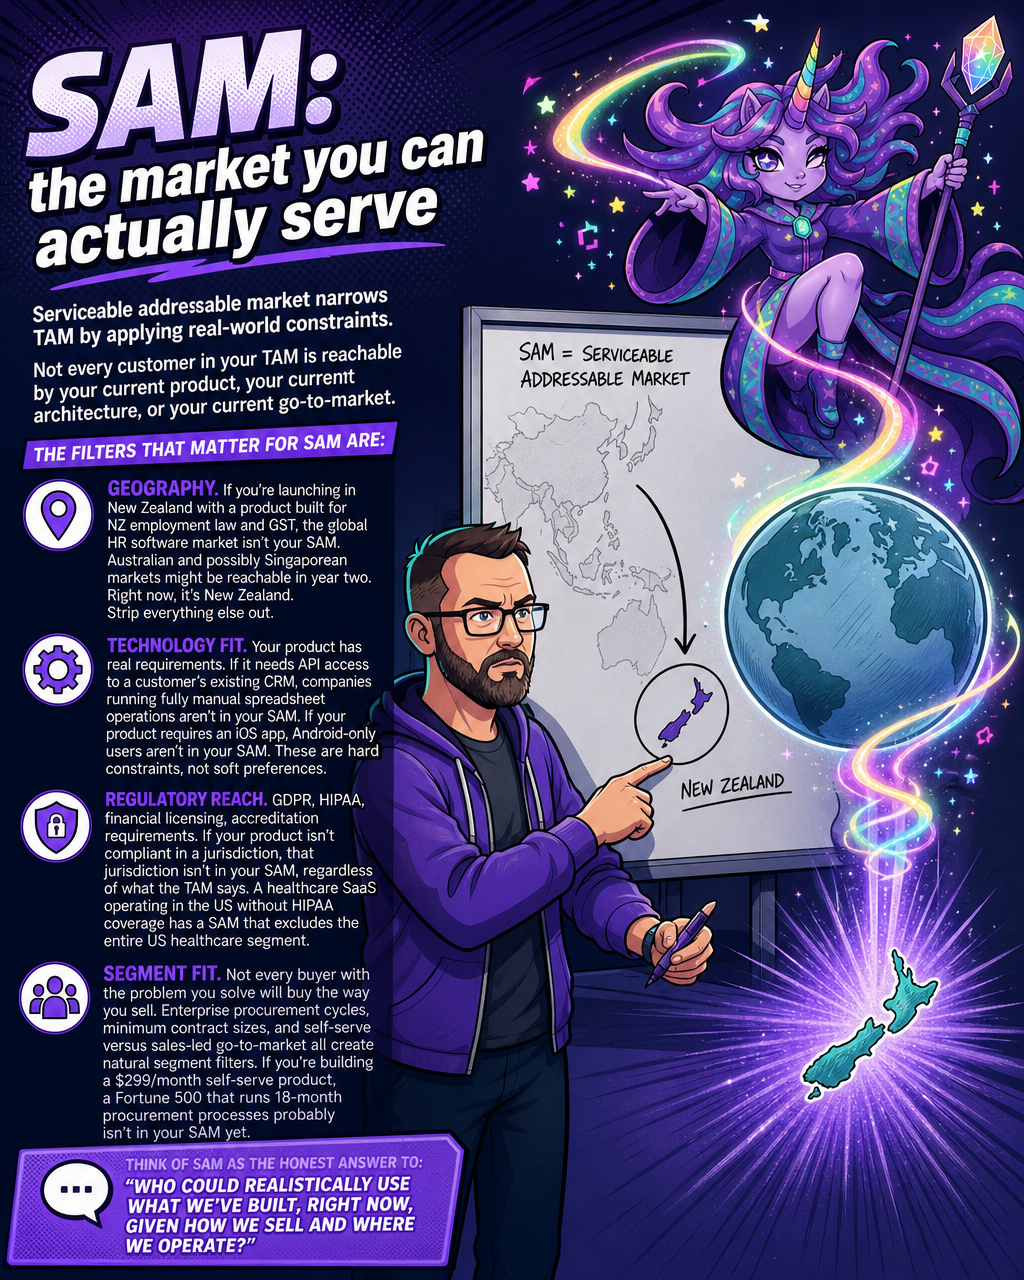
Serviceable addressable market narrows TAM by applying real-world constraints. Not every customer in your TAM is reachable by your current product, your current architecture, or your current go-to-market.
The filters that matter for SAM are:
Geography. If you're launching in New Zealand with a product built for NZ employment law and GST, the global HR software market isn't your SAM. Australian and possibly Singaporean markets might be reachable in year two. Right now, it's New Zealand. Strip everything else out.
Technology fit. Your product has real requirements. If it needs API access to a customer's existing CRM, companies running fully manual spreadsheet operations aren't in your SAM. If your product requires an iOS app, Android-only users aren't in your SAM. These are hard constraints, not soft preferences.
Regulatory reach. GDPR, HIPAA, financial licensing, accreditation requirements. If your product isn't compliant in a jurisdiction, that jurisdiction isn't in your SAM, regardless of what the TAM says. A healthcare SaaS operating in the US without HIPAA coverage has a SAM that excludes the entire US healthcare segment.
Segment fit. Not every buyer with the problem you solve will buy the way you sell. Enterprise procurement cycles, minimum contract sizes, and self-serve versus sales-led go-to-market all create natural segment filters. If you're building a $299/month self-serve product, a Fortune 500 that runs 18-month procurement processes probably isn't in your SAM yet.
Think of SAM as the honest answer to: "who could realistically use what we've built, right now, given how we sell and where we operate?"
SOM: the number that drives your roadmap
Serviceable obtainable market is the slice of SAM you can actually capture given real constraints. This is the number that should drive your early roadmap decisions, your hiring plans, and your first-year revenue targets.
SOM is bounded by three things that have nothing to do with market size:
Sales capacity. How many deals can your current team close per month? A solo founder with no SDR and a short demo cycle has a real capacity ceiling — the exact number depends heavily on product complexity, price point, and sales motion, but the point is that ceiling exists regardless of how big the SAM is.
Distribution. Which channels can you actually reach customers through? If you're relying on inbound content and founder-led sales in Auckland, your distribution is geographically and capacity-constrained. That shapes what's obtainable.
Competitive dynamics. Even in a fragmented market, incumbents have installed customers, switching costs, and brand recognition. As a rough sanity check, early-stage companies rarely capture more than a small fraction of SAM in year one — often well under 5% — though the right number depends heavily on market concentration, go-to-market motion, and competitive landscape.
SOM is where you stop theorizing and start planning. If your SOM in year one is $800,000 and you're pricing at $4,000 ACV, you need 200 customers. Do you have a distribution path to 200 customers? What sales capacity does that require? Those answers tell you what to build, who to hire, and where to focus.
Why over-indexing on TAM loses you credibility
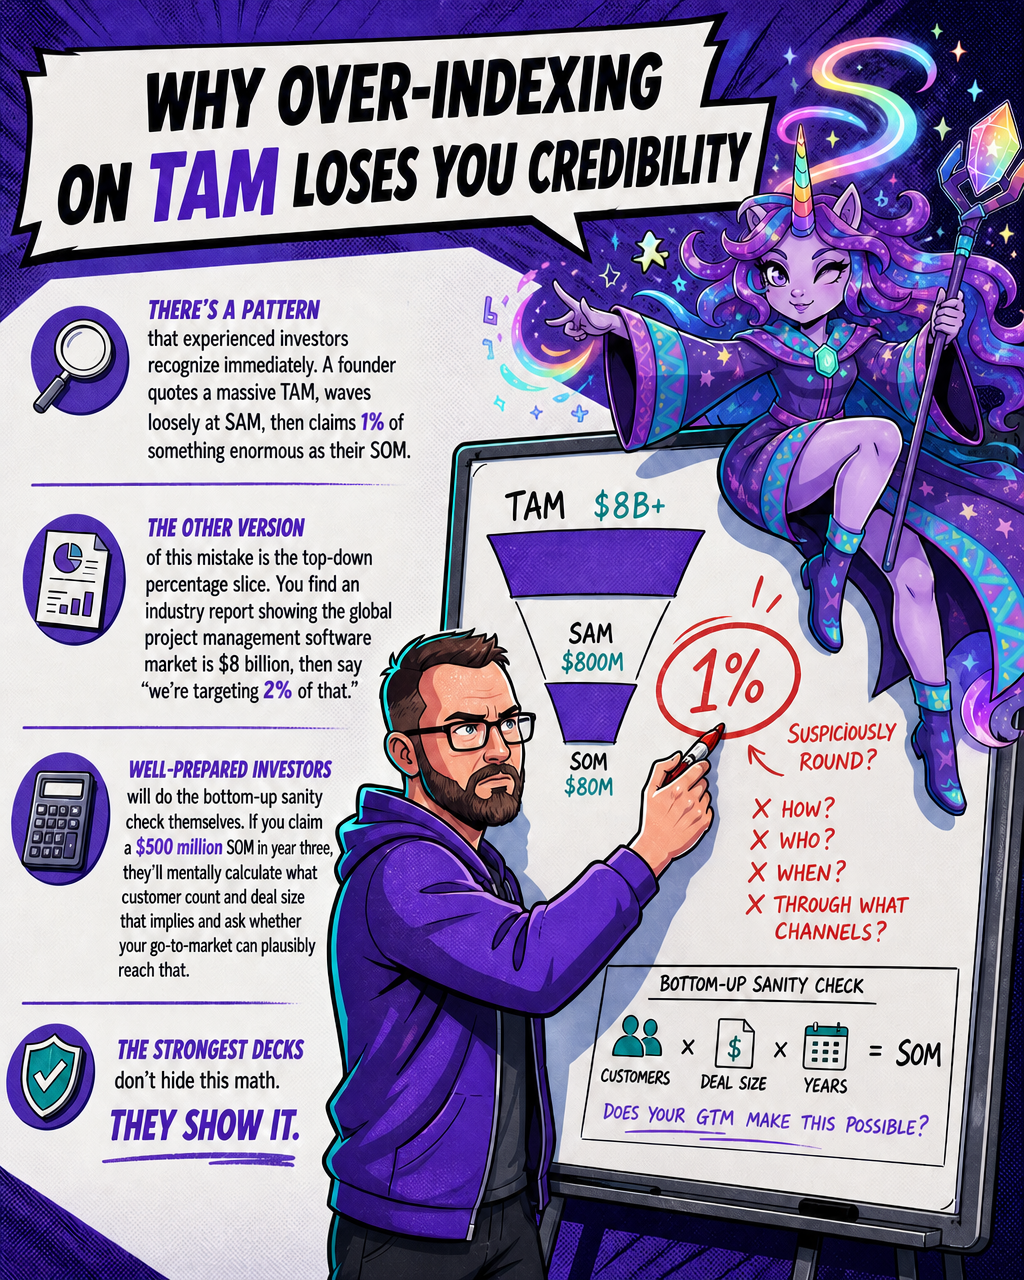
There's a pattern that experienced investors recognize immediately. A founder quotes a massive TAM, waves loosely at SAM, then claims 1% of something enormous as their SOM. Experienced investors quickly spot when a founder claims 1% of a massive market without explaining how they'd actually reach those customers. Getting 1% of a massive market is genuinely hard, and presenting it as the easy path signals you don't understand distribution. It suggests you've never had to build a sales pipeline.
The other version of this mistake is the top-down percentage slice. You find an industry report showing the global project management software market is $8 billion, then say "we're targeting 2% of that." The problem is that a 2% claim isn't defensible. You can't trace it back to real customers, real workflows, or real capacity. It's a number you invented to make your deck look tidy.
Well-prepared investors will do the bottom-up sanity check themselves. If you claim a $500 million SOM in year three, they'll mentally calculate what customer count and deal size that implies and ask whether your go-to-market can plausibly reach that. If your answer doesn't connect to real unit counts, the number falls apart on contact.
The strongest decks don't hide this math. They show it.
Bottom-up sizing: count the real units
Bottom-up market sizing builds the estimate from observable, countable reality rather than working backwards from an industry report. The formula is simple: identify how many customers fit your ICP, count them, and multiply by what they'll pay.
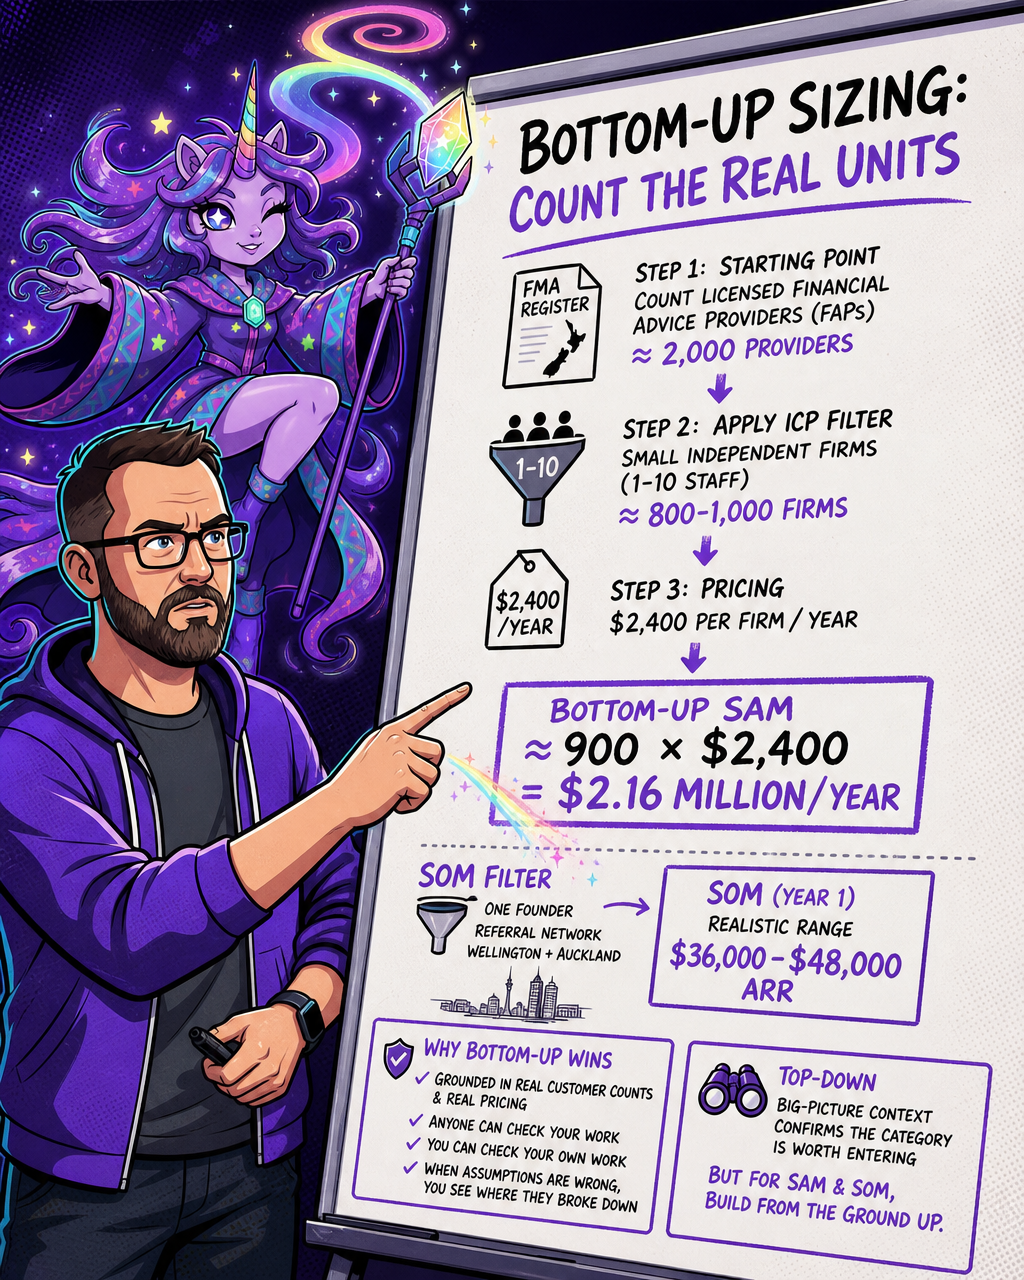
Here's what that looks like in practice. Say you're building a compliance automation tool for financial advice providers in New Zealand. Start with what's countable:
- As a starting point, pull the current FMA register and count licensed Financial Advice Providers (FAPs) — the operative licensing category under New Zealand's financial advice regime since 2021. For illustration, assume approximately 2,000 registered providers, but verify this figure directly from the FMA register with a dated data pull before using it in any pitch.
- Your product targets smaller independent firms — say, those with 1–10 staff — rather than large institutions with dedicated compliance teams. Applying that filter might leave you with something in the range of 800–1,000 firms, but again, this is a working estimate that requires real verification rather than assumption.
- Your pricing is $2,400/year per firm.
- Bottom-up SAM: using the illustrative figures above, roughly 900 × $2,400 = $2.16 million annually. Your actual SAM will depend on your verified customer count.
Now apply your SOM filter. You're one founder with a referral network in Wellington and Auckland. In year one, you could realistically reach a subset of those firms and close a fraction of them with strong product-market fit — producing a SOM that might be in the range of $36,000–$48,000 ARR, depending on your conversion rate and outreach capacity. Not impressive-sounding, but honest, and a number you can actually defend.
The bottom-up approach is more defensible because it's grounded in real customer counts and real pricing. Anyone can check your work. You can check your own work. And when your assumptions are wrong, you can see exactly where they broke down.
Top-down sizing still has a role. It gives you the big-picture context and confirms the category is worth entering. But for SAM and SOM specifically, build from the ground up.
A quick comparison
| Top-down | Bottom-up | |
|---|---|---|
| Starts from | Industry report | Customer count |
| Good for | TAM context | SAM and SOM |
| Weakness | Assumptions are hard to defend | More time-consuming |
| Investor reaction | Useful as backdrop | Preferred for credibility |
| What it signals | Market exists | You understand the customer |
The best founders use both. Top-down shows the prize is worth pursuing. Bottom-up proves you've counted the actual customers and understand the path to capturing them.
What this means for your roadmap
Here's the practical payoff. When SOM is grounded in real sales capacity and real customer counts, it stops being a pitch exercise and becomes a planning tool.
If your year-one SOM implies 50 customers and your current conversion rate from demo to close is 20%, you need 250 demos. That tells you what your top-of-funnel needs to produce. That tells you what Supramono's Dart module (for lead sourcing), Craft (for content), and Forge (for outbound sequencing) need to produce in your pipeline.
Engineers are particularly good at this kind of reasoning when they apply it to market sizing rather than just to system architecture. You already think in constraints, capacity limits, and failure modes. A market model is just a different kind of system.
The discipline is the same: don't optimise for numbers that look good. Optimise for numbers that hold up.
The summary
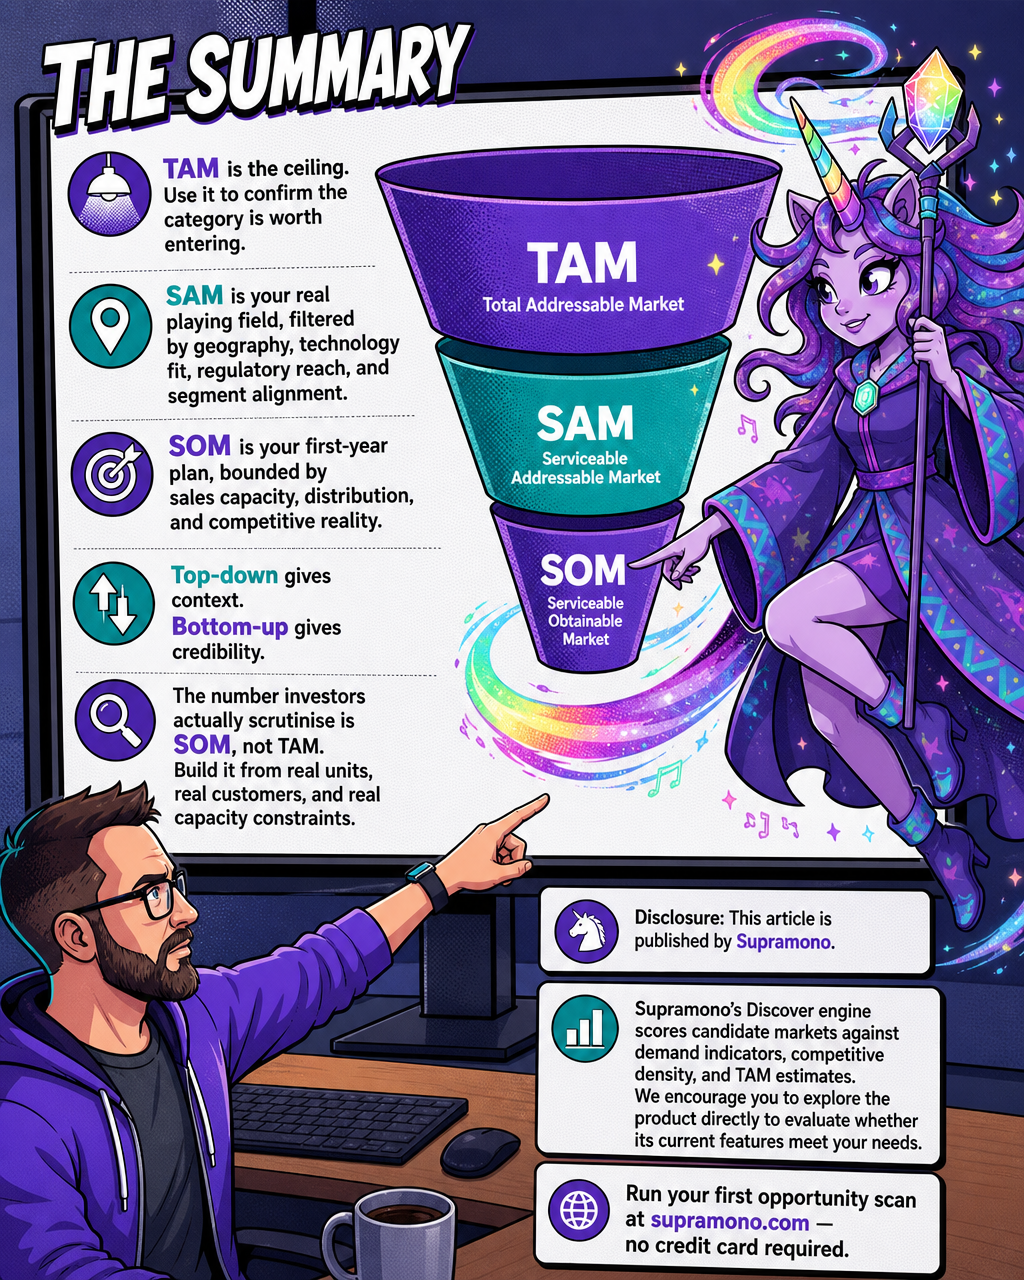
- TAM is the ceiling. Use it to confirm the category is worth entering.
- SAM is your real playing field, filtered by geography, technology fit, regulatory reach, and segment alignment.
- SOM is your first-year plan, bounded by sales capacity, distribution, and competitive reality.
- Top-down gives context. Bottom-up gives credibility.
- The number investors actually scrutinise is SOM, not TAM. Build it from real units, real customers, and real capacity constraints.
Disclosure: This article is published by Supramono.
Supramono's Discover engine scores candidate markets against demand indicators, competitive density, and TAM estimates. We encourage you to explore the product directly to evaluate whether its current features meet your needs.
Run your first opportunity scan at supramono.com — no credit card required.
Supramono
The agentic GTM platform for small marketing agencies
The agentic GTM platform for small marketing agencies
Learn more about Supramono and get started today.
Visit Supramono